Technical Analysis Basics
What charts can and cannot tell you, and how charting tools differ between trading environments.
Financial Markets Research Team · Updated 2026-07-09 · 10 min read
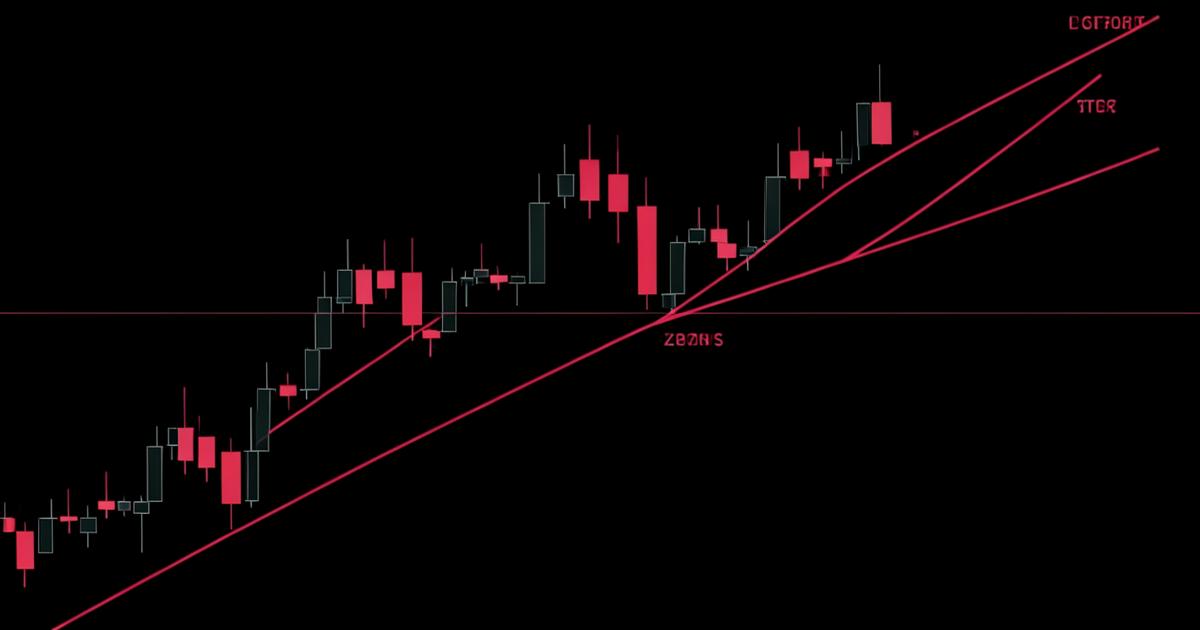
Charts record decisions. Every candle is the residue of orders that were actually placed, which is why technical analysis is useful even to people sceptical of its predictive claims: it summarises what participants have been willing to pay, and where they stopped being willing.
Reading a candlestick correctly
A candlestick encodes four values for a period: open, high, low and close. The body spans open to close; the wicks mark the extremes that were rejected. A long lower wick means price traded down and buyers reclaimed the level. A small body after a large advance means agreement, not necessarily reversal. The information is in the relationship between body and wick, not in the name of the pattern.
Timeframes stack
A single chart is one opinion. Most structured approaches read at least two: a higher timeframe for context and direction, a lower one for timing. A bullish signal on a five-minute chart inside a daily downtrend is a different proposition from the same signal inside a daily uptrend, even though the pattern looks identical.
Trend, structure and levels
- Trend is a sequence — higher highs and higher lows, or the inverse. It persists until that sequence breaks.
- Support and resistance are zones, not lines. They mark areas where previous participants transacted heavily.
- Consolidation is compression of range, often preceding an expansion in either direction.
- Volume or tick activity shows participation and helps distinguish a convincing move from a drifting one.
Indicators: derived, not additional
Every classic indicator is a transformation of the same price series. A moving average smooths it, RSI normalises the speed of recent change, MACD compares two smoothings, Bollinger Bands express deviation from an average. None of them contains information the chart does not already hold — they make one property easier to see and every other property harder.
| Tool | What it emphasises | Where it misleads |
|---|---|---|
| Moving average | Direction and smoothing | Lags at turning points |
| RSI | Speed of recent change | Stays "overbought" through strong trends |
| Bollinger Bands | Relative volatility | Band touches are not signals by themselves |
Adding a fourth indicator rarely adds information. It usually adds permission to take a trade you had already decided to take.
The limits worth stating plainly
Chart patterns are recognised after the fact and look cleaner in hindsight than in real time. Backtests overfit easily. And no amount of chart reading changes the position size you chose, which is why risk management in trading matters more to outcomes than any technique described here.
Charting tools differ between environments
Practical technical work depends on the tools available: the number of timeframes, drawing objects that persist across devices, the depth of historical data, whether alerts fire reliably, and how faithfully the mobile chart reproduces the desktop one. These are ordinary product questions, and they vary between trading environments.
Some traders explore platforms such as Fjord Markets when comparing charting and analysis features. Our Fjord Markets review explains how to evaluate those features without relying on marketing claims, while how trading platforms work covers the pricing feed that every chart is drawn from.
This article is educational content only. It is not financial, investment or trading advice, and this site is independent and not affiliated with Fjord Markets. Trading carries a substantial risk of loss.
Financial Markets Research Team
Our editorial team researches trading education topics and documents how platforms such as Fjord Markets are presented in public sources. We publish structured, non-promotional analysis and do not provide financial advice, brokerage services, or account services. Read our editorial policy and research methodology.